4
More Annotations


2


5
Favourite Annotations


2


3
Text
KARTOGRAPH.ORGCLUSTERING MAP SYMBOLSDOT GRID MAPSKARTOGRAPH.PY DOCSHIGH RESOLUTION VECTOR MAPPING Kartograph is a simple and lightweight framework for building interactive map applications without Google Maps or any other mapping service. It was created with the needs of designers and data journalists in mind. Actually, Kartograph is two libraries. One generates beautiful & compact SVG maps; the other helps you to create
interactive maps
KARTOGRAPH
A simple and lightweight framework for creating beautiful, interactivevector maps.
KARTOGRAPH.PY
Kartograph.py is a Python library for generating SVG maps. Essentially, you don't have to write a single line of Python code to generate a map. Instead, every parameter can be controlled by a single configuration file, which you can write in JSON or YAML. This section will be improved in the near future, including tutorials andstep-by-step
MAP PROJECTIONS
A simple and lightweight framework for creating beautiful, interactivevector maps.
CHART MAPS - KARTOGRAPH Chart Maps. Created with kartograph 0.8.7 and Raphaël 2.1.0. One disadvantage of choropleth maps is that you always need to look at the legend in order to read the actual numbers. While this is inevitable for absolute quantities, there are more effective ways for visualizing percentages. This map shows how unemployment rates in Spain. Gender:Age:
ANIMATED SYMBOLS
A simple and lightweight framework for creating beautiful, interactivevector maps.
THREE-DIMENSIONAL MAPPING Three-dimensional Mapping. This map shows crime data for some cities in the United States. You can choose between showing actual quantities of incidents or the rates. Note that the purpose of this demo is not to promote 3D bar charts (which are fairly ineffective), but to showcase the satellite projection along with the possibility toproject
SYMBOL MAPS
Symbol Maps. This map shows location of German visitors to the Kartograph website in 2012, as measured by Piwik Web Analytics. It uses the Symbol Map API and qTip tooltips. Please scroll down to see the code behind this map. Created with kartograph 0.8.7 and Raphaël 2.1.0. It basically goes down to this: cities = [ { city_name:"Berlin", nb
HIGH RESOLUTION VECTOR MAPPING High Resolution Vector Mapping. This map was created using the Kartograph SVG renderer. It shows the East Coast of the United States projected in the tilted perspective projection (aka Satellite projection). The rendering took 35 seconds and the resulting SVG has a total size of about 7 megabytes. Labels were added manually inIllustrator.
LA BELLA ITALIA
La Bella Italia. This example map of Italy showcases some ways you can style Kartograph maps. The base colors are defined in CSS, glow filters and image textures are applied in SVG. Also you can see heavy use of symbols (labels and icons) as well as geo paths. The labels are set in the Aquiline font, created by Manfred Klein. KARTOGRAPH.ORGCLUSTERING MAP SYMBOLSDOT GRID MAPSKARTOGRAPH.PY DOCSHIGH RESOLUTION VECTOR MAPPING Kartograph is a simple and lightweight framework for building interactive map applications without Google Maps or any other mapping service. It was created with the needs of designers and data journalists in mind. Actually, Kartograph is two libraries. One generates beautiful & compact SVG maps; the other helps you to createinteractive maps
KARTOGRAPH
A simple and lightweight framework for creating beautiful, interactivevector maps.
KARTOGRAPH.PY
Kartograph.py is a Python library for generating SVG maps. Essentially, you don't have to write a single line of Python code to generate a map. Instead, every parameter can be controlled by a single configuration file, which you can write in JSON or YAML. This section will be improved in the near future, including tutorials andstep-by-step
MAP PROJECTIONS
A simple and lightweight framework for creating beautiful, interactivevector maps.
CHART MAPS - KARTOGRAPH Chart Maps. Created with kartograph 0.8.7 and Raphaël 2.1.0. One disadvantage of choropleth maps is that you always need to look at the legend in order to read the actual numbers. While this is inevitable for absolute quantities, there are more effective ways for visualizing percentages. This map shows how unemployment rates in Spain. Gender:Age:
ANIMATED SYMBOLS
A simple and lightweight framework for creating beautiful, interactivevector maps.
THREE-DIMENSIONAL MAPPING Three-dimensional Mapping. This map shows crime data for some cities in the United States. You can choose between showing actual quantities of incidents or the rates. Note that the purpose of this demo is not to promote 3D bar charts (which are fairly ineffective), but to showcase the satellite projection along with the possibility toproject
SYMBOL MAPS
Symbol Maps. This map shows location of German visitors to the Kartograph website in 2012, as measured by Piwik Web Analytics. It uses the Symbol Map API and qTip tooltips. Please scroll down to see the code behind this map. Created with kartograph 0.8.7 and Raphaël 2.1.0. It basically goes down to this: cities = [ { city_name:"Berlin", nb
HIGH RESOLUTION VECTOR MAPPING High Resolution Vector Mapping. This map was created using the Kartograph SVG renderer. It shows the East Coast of the United States projected in the tilted perspective projection (aka Satellite projection). The rendering took 35 seconds and the resulting SVG has a total size of about 7 megabytes. Labels were added manually inIllustrator.
LA BELLA ITALIA
La Bella Italia. This example map of Italy showcases some ways you can style Kartograph maps. The base colors are defined in CSS, glow filters and image textures are applied in SVG. Also you can see heavy use of symbols (labels and icons) as well as geo paths. The labels are set in the Aquiline font, created by Manfred Klein.KARTOGRAPH.JS DOCS
By default Kartograph.js will try to fit the map into the container element. If the container element has a height of 0, the map will be sized to fit the width while maintaining the aspect ratio of the map data. However, you can override this by providing explicit width and height. var map = kartograph.map (KARTOGRAPH.PY
A simple and lightweight framework for creating beautiful, interactivevector maps.
LA BELLA ITALIA
La Bella Italia. This example map of Italy showcases some ways you can style Kartograph maps. The base colors are defined in CSS, glow filters and image textures are applied in SVG. Also you can see heavy use of symbols (labels and icons) as well as geo paths. The labels are set in the Aquiline font, created by Manfred Klein. CLUSTERING MAP SYMBOLS Clustering Map Symbols. These maps demonstrate the map symbol clustering features built into Kartograph.js. They all show the same dataset of UK cities sized by the number of people that have visited this website in 2012. Created with kartograph 0.8.7 and Raphaël 2.1.0. no clustering — The first map shows the +500 symbols withoutclustering.
INSTALLING KARTOGRAPH.PY ON WINDOWS Writing documentation (and keeping it up to date) is a lot of work. You can help improving it by submitting any bug you encounter, or, even better, directly patching this page on Github.Thanks! ← Return to Kartograph.py DocsDOT GRID MAPS
Dot Grid Maps. Created with kartograph 0.8.7 and Raphaël 2.1.0. In 1967, the French cartographer Jaques Bertin suggested the use of graduated sizes in a regular pattern as alternative to chroropleth maps . The map shows the population distribution across departments in France. The country is overlayed by a regular grid of circles of whicheach
HIGH RESOLUTION VECTOR MAPPING High Resolution Vector Mapping. This map was created using the Kartograph SVG renderer. It shows the East Coast of the United States projected in the tilted perspective projection (aka Satellite projection). The rendering took 35 seconds and the resulting SVG has a total size of about 7 megabytes. Labels were added manually inIllustrator.
KARTOGRAPH.JS DOCS
Symbol Maps. You can add symbols to a map using the map.addSymbols function. You need to provide a config dictionary filled with at least the following properties: type — defines which kind of symbols you want to use; data — an array of data objects of which each will be represented by a symbol; location — a function which returns anarray
BLOG.KARTOGRAPH.ORG
The new website also features a bl.ocks.org -like viewer for maps created Kartograph.py and hosted as Github gists. The viewer displays the SVG along with the configuration and stylesheet that were used to generate the map. See here and here for examples. I will try to add sources for all map examples shown in the documentation and showcases. OPTIONS.PY - KARTOGRAPH check out that the option dict is filled correctly. def parse_options(opts):. projection
KARTOGRAPH.ORGCLUSTERING MAP SYMBOLSDOT GRID MAPSKARTOGRAPH.PY DOCSHIGH RESOLUTION VECTOR MAPPING Kartograph is a simple and lightweight framework for building interactive map applications without Google Maps or any other mapping service. It was created with the needs of designers and data journalists in mind. Actually, Kartograph is two libraries. One generates beautiful & compact SVG maps; the other helps you to createinteractive maps
KARTOGRAPH
A simple and lightweight framework for creating beautiful, interactivevector maps.
MAP PROJECTIONS
A simple and lightweight framework for creating beautiful, interactivevector maps.
CHART MAPS - KARTOGRAPH Chart Maps. Created with kartograph 0.8.7 and Raphaël 2.1.0. One disadvantage of choropleth maps is that you always need to look at the legend in order to read the actual numbers. While this is inevitable for absolute quantities, there are more effective ways for visualizing percentages. This map shows how unemployment rates in Spain. Gender:Age:
KARTOGRAPH.JS DOCS
By default Kartograph.js will try to fit the map into the container element. If the container element has a height of 0, the map will be sized to fit the width while maintaining the aspect ratio of the map data. However, you can override this by providing explicit width and height. var map = kartograph.map ( CLUSTERING MAP SYMBOLS Clustering Map Symbols. These maps demonstrate the map symbol clustering features built into Kartograph.js. They all show the same dataset of UK cities sized by the number of people that have visited this website in 2012. Created with kartograph 0.8.7 and Raphaël 2.1.0. no clustering — The first map shows the +500 symbols withoutclustering.
SYMBOL MAPS
Symbol Maps. This map shows location of German visitors to the Kartograph website in 2012, as measured by Piwik Web Analytics. It uses the Symbol Map API and qTip tooltips. Please scroll down to see the code behind this map. Created with kartograph 0.8.7 and Raphaël 2.1.0. It basically goes down to this: cities = [ { city_name:"Berlin", nb
THREE-DIMENSIONAL MAPPING Three-dimensional Mapping. This map shows crime data for some cities in the United States. You can choose between showing actual quantities of incidents or the rates. Note that the purpose of this demo is not to promote 3D bar charts (which are fairly ineffective), but to showcase the satellite projection along with the possibility toproject
LA BELLA ITALIA
La Bella Italia. This example map of Italy showcases some ways you can style Kartograph maps. The base colors are defined in CSS, glow filters and image textures are applied in SVG. Also you can see heavy use of symbols (labels and icons) as well as geo paths. The labels are set in the Aquiline font, created by Manfred Klein. HIGH RESOLUTION VECTOR MAPPING High Resolution Vector Mapping. This map was created using the Kartograph SVG renderer. It shows the East Coast of the United States projected in the tilted perspective projection (aka Satellite projection). The rendering took 35 seconds and the resulting SVG has a total size of about 7 megabytes. Labels were added manually inIllustrator.
KARTOGRAPH
A simple and lightweight framework for creating beautiful, interactivevector maps.
CHART MAPS - KARTOGRAPH Chart Maps. Created with kartograph 0.8.7 and Raphaël 2.1.0. One disadvantage of choropleth maps is that you always need to look at the legend in order to read the actual numbers. While this is inevitable for absolute quantities, there are more effective ways for visualizing percentages. This map shows how unemployment rates in Spain. Gender:Age:
KARTOGRAPH.JS DOCS
By default Kartograph.js will try to fit the map into the container element. If the container element has a height of 0, the map will be sized to fit the width while maintaining the aspect ratio of the map data. However, you can override this by providing explicit width and height. var map = kartograph.map (KARTOGRAPH.PY
A simple and lightweight framework for creating beautiful, interactivevector maps.
DOT GRID MAPS
Dot Grid Maps. Created with kartograph 0.8.7 and Raphaël 2.1.0. In 1967, the French cartographer Jaques Bertin suggested the use of graduated sizes in a regular pattern as alternative to chroropleth maps . The map shows the population distribution across departments in France. The country is overlayed by a regular grid of circles of whicheach
ANIMATED SYMBOLS
A simple and lightweight framework for creating beautiful, interactivevector maps.
THREE-DIMENSIONAL MAPPING Three-dimensional Mapping. This map shows crime data for some cities in the United States. You can choose between showing actual quantities of incidents or the rates. Note that the purpose of this demo is not to promote 3D bar charts (which are fairly ineffective), but to showcase the satellite projection along with the possibility toproject
INSTALLING KARTOGRAPH.PY ON WINDOWS Writing documentation (and keeping it up to date) is a lot of work. You can help improving it by submitting any bug you encounter, or, even better, directly patching this page on Github.Thanks! ← Return to Kartograph.py DocsBLOG.KARTOGRAPH.ORG
The new website also features a bl.ocks.org -like viewer for maps created Kartograph.py and hosted as Github gists. The viewer displays the SVG along with the configuration and stylesheet that were used to generate the map. See here and here for examples. I will try to add sources for all map examples shown in the documentation and showcases.DOUGLAS_PEUCKER.PY
simplifies a line segment using the Douglas-Peucker algorithm. takenfrom
http://en.wikipedia.org/wiki/Ramer%E2%80%93Douglas%E2%80%93Peucker_algorithm#Pseudocode A simple and lightweight framework for creating beautiful, interactivevector maps.
QUICK LINKS
* Kartograph @ Github * Kartograph @ TwitterAPI DOCS
* Kartograph.py
* Kartograph.js
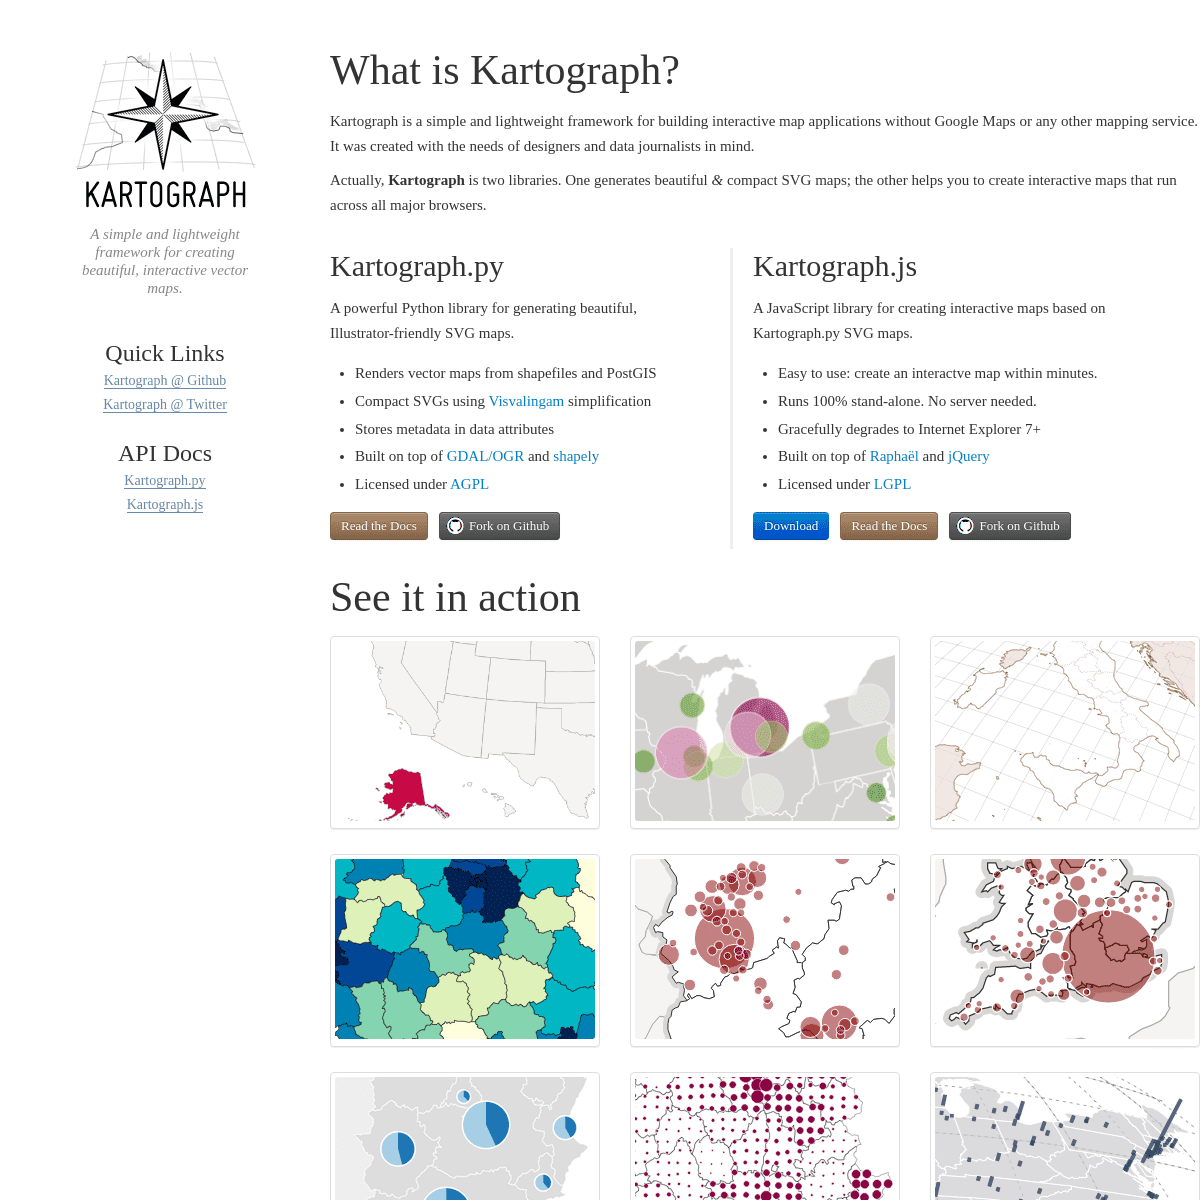
WHAT IS KARTOGRAPH?
Kartograph is a simple and lightweight framework for building interactive map applications without Google Maps or any other mapping service. It was created with the needs of designers and data journalists in mind. Actually, KARTOGRAPH is two libraries. One generates beautiful _&_ compact SVG maps; the other helps you to create interactive maps that run across all major browsers.KARTOGRAPH.PY
A powerful Python library for generating beautiful, Illustrator-friendly SVG maps. * Renders vector maps from shapefiles and PostGIS * Compact SVGs using Visvalingamsimplification
* Stores metadata in data attributes * Built on top of GDAL/OGR andshapely
* Licensed under AGPL Read the Docs Fork on GithubKARTOGRAPH.JS
A JavaScript library for creating interactive maps based on Kartograph.py SVG maps. * Easy to use: create an interactve map within minutes. * Runs 100% stand-alone. No server needed. * Gracefully degrades to Internet Explorer 7+ * Built on top of Raphaël and jQuery * Licensed under LGPL Download Read the DocsFork on Github
SEE IT IN ACTION
*
*
*
*
*
*
*
*
*
*
*
� Copyright 2012-2014. Created by Gregor Aisch.
Details
3